
What Metrics and Dashboards Should Sales Leaders Track for SDR and AE Performance? Essential KPIs to Drive Revenue Growth
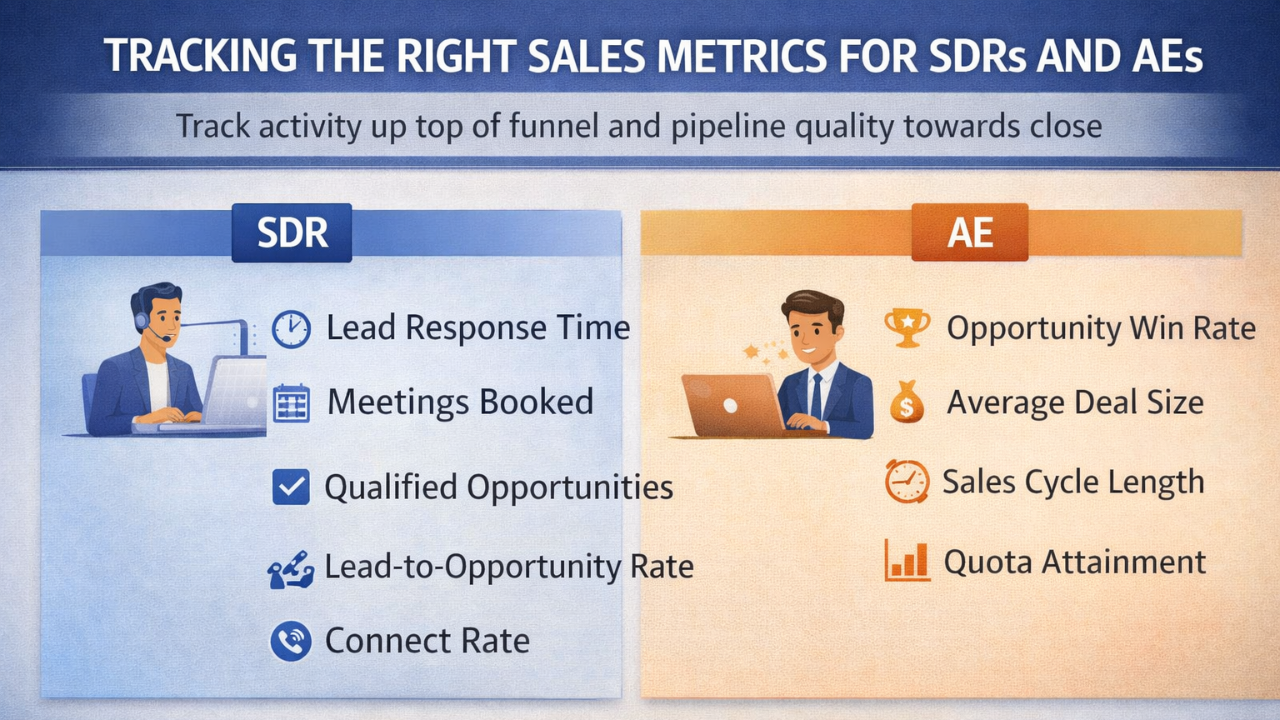
Mar 24, 2026Sales leaders need visibility into performance data that actually drives revenue, not just activity logs. The most critical metrics for SDR performance include lead response time, qualified meetings set, and lead-to-opportunity conversion rate, while AE dashboards should prioritize opportunity win rate, average deal size, sales cycle length, and quota attainment. Yet many organizations still waste time on vanity numbers that look impressive but fail to predict pipeline health or revenue outcomes.
Understanding which SDR metrics truly impact pipeline growth separates high-performing teams from those spinning their wheels. I've seen sales organizations transform their results by shifting focus from raw call volume to conversion efficiency and quality indicators. The challenge isn't collecting data—it's knowing which numbers deserve your attention and how to interpret them within the broader sales context.
This guide breaks down the specific metrics and dashboard configurations that matter for both SDRs and AEs. I'll show you how to balance activity tracking with outcome measurement, identify early warning signs of performance issues, and build dashboards that give you a complete picture without overwhelming your team with unnecessary data points.
Key Takeaways
- Track activity metrics like calls and emails alongside conversion rates to understand both effort and effectiveness
- Focus on pipeline metrics including qualified meetings set, opportunity creation rate, and deal velocity for predictive insights
- Build dashboards that separate input activities from output results to identify coaching opportunities and forecast revenue accurately
Essential Metrics and KPIs for SDR and AE Performance
Sales metrics must distinguish between meaningful indicators and surface-level numbers that don't drive decisions. SDRs and AEs operate at different stages of the sales funnel, requiring distinct measurement frameworks that align with their specific responsibilities and revenue impact.
Defining Sales Metrics, KPIs, and Vanity Metrics
Sales metrics are quantifiable measures that track specific activities or outcomes in the sales process. KPIs represent the subset of metrics that directly correlate with business objectives and revenue generation.
Vanity metrics appear impressive but lack actionable insight or clear connection to revenue. Total email sends or LinkedIn profile views fall into this category because they don't indicate prospect engagement quality or pipeline movement.
I focus on metrics that reveal conversion efficiency and pipeline velocity. For SDRs, connected calls matter more than dial volume. For AEs, average deal size and win rate provide clearer performance signals than total proposals sent.
The distinction centers on predictive value. A KPI should answer whether the sales motion is healthy and sustainable. Activity counts alone don't accomplish this without conversion context.
Key Differences Between SDR and AE Measurement
SDRs generate pipeline through outbound prospecting and inbound lead qualification. I measure their performance through meetings booked, qualified opportunities created, and lead-to-opportunity conversion rates.
AEs own the deal from qualification through close. Their core metrics include pipeline value, average deal size, sales cycle length, and win rate. Revenue attainment and quota achievement become primary indicators.
SDR Metrics:
- Meetings booked per week
- Qualified opportunities created
- Lead response time
- Connect rate
AE Metrics:
- Closed-won revenue
- Average contract value
- Win rate percentage
- Sales cycle duration
The handoff quality between SDR and AE teams requires measurement too. I track opportunity acceptance rate and first-meeting-to-SQL conversion to ensure alignment between functions.
Aligning Metrics With Sales Cycle Stages
Early-stage metrics for sales development focus on volume and efficiency. I track outreach activities, response rates, and conversation-to-meeting conversion at the top of funnel.
Mid-stage measurement shifts to qualification accuracy and opportunity progression. Discovery completion rates and proposal conversion indicate whether AEs are advancing deals effectively through evaluation phases.
Late-stage metrics emphasize closing efficiency and deal economics. I monitor metrics like days in each pipeline stage, discount frequency, and contract negotiation duration to identify bottlenecks before close.
Sales performance indicators must align with where prospects sit in the buying journey. This stage-based approach reveals which part of the sales motion needs improvement rather than applying uniform measurement across different revenue functions.
SDR Activity Metrics: Measuring Outreach and Engagement
Activity metrics form the foundation of SDR performance tracking because they measure the actual volume and quality of prospecting efforts. These numbers reveal how consistently SDRs are executing outreach across multiple channels and whether their approach generates meaningful engagement.
Call Volume and Connection Rate
I track call volume as a primary indicator of SDR effort and consistency. The number of calls made per day typically ranges from 50-100 for high-performing SDRs, though this varies by industry and target market complexity.
Connect rate measures how many calls result in actual conversations with prospects. A strong connect rate falls between 10-15%, though some industries see lower rates due to gatekeepers or call screening technology. I calculate this by dividing connected calls by total dial attempts.
Contact rate provides a broader view by including voicemails and any form of acknowledgment. This metric helps me understand whether poor connection rates stem from bad data, timing issues, or inadequate persistence. When connect rates drop below 5%, I investigate the quality of contact lists and calling strategies being deployed.
Email Activity, Deliverability, and Reply Rates
I monitor emails sent as a volume metric, but email deliverability tells me whether messages actually reach prospect inboxes. Deliverability rates below 95% indicate list quality problems or technical issues with email infrastructure that need immediate attention.
Open rates provide limited value due to privacy changes, but reply rate remains the most critical email metric. Strong email response rates range from 3-8% depending on personalization quality and targeting precision. I track this by measuring replies against total emails delivered, not just sent.
Personalized emails consistently outperform generic templates. I segment reply rates by email type to identify which personalization approaches drive engagement and which fall flat with prospects.
Social and Multi-Channel Touches
LinkedIn interactions complement email and phone outreach. I track LinkedIn touches including connection requests, InMail messages, and content engagement as part of total sales engagement activity.
Social touches work best when integrated into multi-channel sequences rather than as standalone tactics. I measure the contribution of LinkedIn interactions by tracking how many meetings result from sequences that include social outreach versus those without.
A sales engagement platform helps consolidate activity metrics across channels. I use these tools to ensure SDRs maintain consistent touch patterns and to identify which channel combinations produce the highest engagement rates for different buyer personas.
Conversion and Outcome Metrics: From Leads to Pipeline
Tracking how leads move through qualification stages and convert into pipeline opportunities reveals the true effectiveness of your SDR and AE teams. These metrics show whether your team generates quality meetings, properly qualifies prospects, and creates valuable pipeline.
Meetings Booked and Held
I track both meetings booked and meetings held because the gap between these two numbers reveals critical insights about lead quality and scheduling efficiency. A high booking rate with low show rates often indicates poor targeting or unclear value communication during outreach.
The meeting held rate calculates as (meetings held / meetings booked) × 100. I consider 70-80% a healthy benchmark for most B2B sales teams. When this rate drops below 65%, I investigate whether SDRs are booking unqualified prospects or failing to send proper confirmation and reminder sequences.
I also measure the time between booking and holding meetings. Shorter timeframes typically result in higher attendance rates. When meetings are scheduled more than two weeks out, no-show rates increase significantly.
Key metrics I monitor:
- Meetings booked per SDR per week
- Meeting held rate percentage
- Average days between booking and meeting
- No-show rate by lead source
Lead Qualification and SQL Conversion
The lead qualification rate measures how effectively SDRs identify and advance sales-qualified leads from initial contacts. I calculate this as (SQLs created / total leads contacted) × 100 to understand qualification efficiency.
I define sales-qualified leads based on specific criteria like budget authority, need, and timeline. Not all held meetings should become SQLs. A conversion rate of 30-50% from held meetings to SQLs indicates strong qualification discipline.
I track qualified meeting rates separately from total meetings because they reflect lead quality rather than just activity volume. When SDRs book many meetings but generate few SQLs, I know we need better targeting or stricter qualification frameworks.
The SQL-to-opportunity conversion rate shows how well qualified leads actually are. I expect 40-60% of SQLs to convert into opportunities when qualification standards are properly enforced.
Opportunities Created and Pipeline Generation
I measure opportunities created as the primary output metric for SDR teams and an input metric for AE performance. This counts net-new opportunities that meet minimum qualification criteria and pipeline value thresholds.
Pipeline value generated tracks the total dollar amount of opportunities created within a specific period. I calculate this as the sum of all opportunity values created, which provides a more complete picture than opportunity count alone. A team might create fewer opportunities but generate higher pipeline value through better account targeting.
The lead-to-opportunity conversion rate connects top-of-funnel activity to pipeline creation. I calculate this as (opportunities created / total leads worked) × 100. This metric helps me understand the efficiency of the entire qualification process from initial contact through opportunity creation.
I also track pipeline generated per SDR and per AE to set performance benchmarks. These metrics account for both volume and deal size, giving me a complete view of each team member's contribution to revenue potential.
Performance, Efficiency, and Quality Metrics
Speed matters, but quality determines whether deals actually close. I track metrics that measure how quickly my team responds to leads, how well they qualify opportunities, and whether their efforts translate into revenue.
Response Time and Speed to Lead
Lead response time directly impacts conversion rates. I measure time to first contact (TTL) because prospects who receive outreach within five minutes are significantly more likely to convert than those contacted an hour later.
Response time benchmarks vary by industry, but I aim for under five minutes during business hours. I track average response time across the team and by individual rep to identify coaching opportunities.
Speed to lead also includes time to first meeting booked. This metric shows how efficiently SDRs move prospects through initial qualification. If TTL is fast but time to first meeting drags, it signals problems with messaging or qualification criteria.
I monitor these performance metrics in real-time dashboards so managers can intervene when response times slip. Automated alerts help ensure no lead sits unattended for more than 15 minutes.
Meeting Quality and AE Feedback
Qualified meetings booked means nothing if AEs cancel them or prospects don't show. I track meeting show rates and AE feedback scores to measure SDR effectiveness.
AE feedback includes quality scores based on whether prospects match ICP criteria and have genuine interest. I use frameworks like BANT (Budget, Authority, Need, Timeline) or MEDDIC (Metrics, Economic Buyer, Decision Criteria, Decision Process, Identify Pain, Champion) depending on our sales process.
I also measure objection handling effectiveness by tracking common objections raised during meetings. When AEs consistently report the same issues, it indicates SDRs need better discovery or qualification skills.
Meeting quality scores should average 7 out of 10 or higher. Lower scores mean SDRs prioritize quantity over quality, which wastes AE time and damages team relationships.
Win Rate and Closed Deals
Win rate is the ultimate outcome metric for evaluating whether earlier-stage activities generate revenue. I calculate win rate as closed-won deals divided by total opportunities created.
I segment win rate by lead source, rep, and deal size to understand what drives success. SDR-generated opportunities should maintain at least 15-20% win rates, though this varies by industry and sales cycle length.
Closed deals per SDR per quarter shows productivity beyond activity metrics. This performance metric reveals whether individual contributors consistently generate pipeline that converts.
I compare win rates between SDRs to identify top performers whose qualification approach can be replicated. When specific reps show significantly higher win rates, I analyze their discovery calls and handoff notes to extract best practices for team training.
Analyzing Dashboards and Benchmarking Success
Effective dashboard analysis requires selecting the right visibility tools, understanding how your team performs against industry standards, and maintaining clean data that drives accurate decisions.
Choosing the Right Dashboards for Visibility
I recommend selecting dashboards based on your team's specific role and funnel position. SDR dashboards focus on top-of-funnel metrics like outreach volume, meetings booked, and conversion rates, while AE dashboards track deal progression, pipeline value, and close rates.
The key is avoiding the temptation to track everything. I focus on dashboards that display activity-based metrics alongside outcome metrics. For SDRs, this means monitoring daily call volume, email sends, and response rates. For AEs, I track pipeline coverage ratios and deal velocity.
Most teams use platforms like Salesforce or HubSpot as their foundation. A benchmarking dashboard compares key performance metrics against competitors and internal standards, helping identify gaps quickly. I ensure dashboards update in real-time and are accessible to reps, not just leadership, so everyone can self-monitor progress.
Industry Benchmarks and Quotas
I set quotas by first understanding industry benchmarks, then adjusting for my team's market conditions and resources. For SDRs, typical benchmarks include 50-100 daily activities, 8-12 qualified meetings per month, and 15-20% connect rates on calls.
Pipeline coverage is critical for AEs. I maintain a 3:1 pipeline-to-quota ratio as a baseline, though this varies by sales cycle length and close rates. Capacity utilization tells me if reps have enough opportunities to hit quota or if territory assignments need adjustment.
Here's how I structure benchmark tracking:
- Activity volume: Compare individual rep output against team averages and industry standards
- Conversion rates: Track movement between funnel stages relative to benchmarks
- Quota attainment: Monitor percentage of team hitting 80%+ of quota monthly
I review key success metrics aligned with business goals quarterly to ensure quotas remain challenging but achievable.
Avoiding Data Overload and Improving Data Hygiene
Poor data hygiene undermines every dashboard decision I make. I establish clear protocols for how reps enter information into HubSpot or Salesforce, including required fields, standardized naming conventions, and regular audits.
I limit dashboards to 5-8 core metrics maximum. Organizations coordinate data from multiple sources to detect trends and monitor quality metrics, but too many data points create paralysis. I ask myself: "Does this metric drive a specific action?" If not, I remove it.
Common data hygiene issues I address include duplicate records, incomplete contact information, and outdated opportunity stages. I schedule weekly data reviews where reps clean their pipeline and update activity logs. Clean data ensures my benchmarks reflect reality and my quotas are based on accurate historical performance.
Advanced SDR and AE Metrics for Modern Sales Teams
Modern sales organizations require metrics that go beyond basic activity tracking to measure efficiency, technology adoption, and revenue impact. I focus on three critical areas: AI-powered performance optimization, revenue velocity measurements, and prospecting system effectiveness.
Leveraging AI and Automation in SDR Performance
I've observed that modern SDR metrics now capture cross-functional collaboration and integration points between sales development teams, account executives, and marketing. AI SDR tools have changed how I measure performance by automating repetitive tasks and allowing teams to focus on high-value interactions.
Tech adoption rates matter because they directly correlate with productivity gains. I track how quickly SDRs adopt new tools, their usage frequency, and the quality outcomes these technologies produce. When an AI SDR handles initial outreach or qualification, I measure response rates, meeting booking percentages, and handoff quality to human team members.
Automation efficiency becomes critical when evaluating touches per opportunity. I monitor whether automated sequences maintain engagement quality while increasing volume. The key metric I watch is the ratio of automated to manual touches that result in qualified meetings, which helps me optimize where human intervention adds the most value versus where automation suffices.
Sales Velocity, Cycle Length, and Revenue Impact
Sales velocity measures how quickly deals move through the pipeline and generate revenue. I calculate it by multiplying the number of opportunities by average deal size and win rate, then dividing by sales cycle length.
Tracking sales cycle length separately for SDRs and AEs reveals bottlenecks. I measure the time from first SDR contact to qualified meeting, then from meeting to closed deal. Shorter cycles with maintained or improved win rates indicate efficient processes.
Revenue impact and revenue generated metrics tell me which activities actually contribute to the bottom line. I don't just count meetings booked—I track which SDR-sourced opportunities convert and their average deal size. This connects top-of-funnel activity to actual revenue, helping me allocate resources where they generate the highest return.
Optimizing Lists, Prospecting, and Sequence Efficiency
List building quality determines prospecting success before outreach begins. I measure list accuracy by tracking bounce rates, wrong contact percentages, and how many prospects match ideal customer profiles. High-quality lists reduce wasted effort and improve conversion rates from the start.
Sequence efficiency shows me which outreach cadences work best. I track response rates at each touch point, optimal sequence length, and which channel combinations (email, phone, social) produce qualified meetings. The most efficient sequences balance persistence with relevance.
I monitor touches per opportunity as a leading indicator of lead generation effectiveness. Too few touches mean missed opportunities; too many signal poor targeting or messaging. I've found that tracking this metric alongside conversion rates helps me identify the optimal contact frequency for different prospect segments and buying stages.
Frequently Asked Questions
Sales leaders need concrete answers about which metrics drive results and how to implement effective tracking systems. The following questions address common challenges in measuring SDR and AE performance while aligning individual contributions with revenue goals.
What are the key performance indicators (KPIs) for Sales Development Representatives (SDRs) to evaluate daily outreach effectiveness?
I track calls made, emails sent, and connection rate as the foundation of SDR activity metrics. Connection rate measures how many prospects an SDR actually reaches compared to total attempts, which reveals outreach quality beyond raw volume.
Meeting conversion rate shows how effectively SDRs turn conversations into booked appointments. I look for SDRs who book 15 meetings per month on average, with 20% converting into qualified pipeline as a benchmark for strong performance.
Response rate to outreach sequences indicates message relevance and targeting accuracy. I monitor this daily to catch messaging issues early and adjust campaign strategies before they impact pipeline generation.
How can Account Executives (AEs) best track their sales cycle length and conversion rates?
I measure the average number of days from first qualified meeting to closed-won deal to identify bottlenecks. Breaking this down by deal size reveals whether larger opportunities take disproportionately longer to close.
Win rate by opportunity stage shows where deals most commonly stall or fall out of the pipeline. I track conversion rates between each stage, from qualified opportunity through proposal, negotiation, and close.
Pipeline velocity combines deal size, win rate, and sales cycle length into one metric. This tells me how quickly revenue moves through the funnel and highlights which AEs generate the most efficient pipeline progression.
Which metrics should be monitored to assess the quality of leads being passed from SDRs to AEs?
Sales accepted lead rate measures what percentage of SDR-passed opportunities AEs accept as legitimate. A high rejection rate signals misalignment on lead qualification criteria between teams.
Meeting-to-opportunity conversion rate reveals how many SDR meetings turn into qualified pipeline. I expect strong SDR teams to maintain at least 20% conversion from booked meetings to sales-accepted opportunities.
Opportunity-to-close rate for SDR-sourced deals compared to other lead sources shows true lead quality. I track this separately to understand whether SDR-generated pipeline converts at comparable rates to marketing-qualified or inbound leads.
What dashboard visualizations are most effective for tracking team-wide sales performance trends?
I use five to eight metrics per dashboard view to avoid overwhelming users with too much data. Funnel progression charts show movement between stages and highlight where prospects get stuck.
Activity-to-outcome ratio charts display the relationship between calls made, meetings booked, and deals closed. This helps me identify whether performance issues stem from insufficient activity or poor conversion rates.
Trend lines over time reveal whether team performance improves, plateaus, or declines across quarters. I create separate views for SDR dashboards focused on outreach and meetings versus AE dashboards tracking deal progression and pipeline value.
How can sales leaders align SDR and AE metrics with overall business objectives for cohesive performance management?
I start by working backward from revenue targets to determine required pipeline volume. If the company needs $10 million in new revenue with a 25% win rate and $50,000 average deal size, I need 800 qualified opportunities.
Breaking this into individual quotas means calculating how many meetings SDRs must book to generate sufficient opportunities. Tying SDR metrics to business outcomes creates accountability for revenue contribution, not just activity completion.
I align AE metrics by setting pipeline creation and close rate targets that support quarterly revenue goals. This ensures both roles understand how their individual performance directly impacts company-level objectives.
What are the best practices for setting and reviewing quotas for SDRs and AEs to drive optimal performance?
I base quotas on historical performance data rather than arbitrary numbers. Looking at what top performers achieve and what average performers deliver helps me set challenging but attainable targets.
I review quota attainment monthly to spot trends and address performance gaps early. If multiple team members consistently miss targets, I reassess whether quotas reflect market conditions or need adjustment.
I separate activity quotas from outcome quotas to measure both effort and results. SDRs might have quotas for calls made and meetings booked, while AEs have quotas for pipeline generated and deals closed, ensuring role-specific measurement that drives accountability.

